Blog
GIL Fall Review
Gold: Its Role in the World and History
It is time to start thinking big. I am going to lay out some compelling data in an attempt to stretch your time horizon as it pertains to the enormous opportunity in front of us via a renewed bull market in gold. A small consortium of you will both get it AND be able to take action (in many cases once the bets are made—inaction) to make the big money from what is staring us in the face. I waited for the Fed before diving into this intro so as to set the tone about what is next in the very short term. That was actually my mistake and exactly what I talking about in terms of mentality (I’m guilty of this from time to time as well—this piece is an exercise for myself to do the right things) that is short term in nature.
The short term remains fuzzy as GDXJ and the sector has not retained decisively its 50 day moving average. I’m going to lay out some interesting charts, as well as data on volatility that can clearly mentally prepare you for making a lot of money in gold related bets going forward. I believe owning physical gold itself is the safest place to park money in the world, in any asset class, including fiat (paper) cash. The store of value over millennia is unquestionable. It is a proven place to park hard earned money and ensure it keeps it's worth, versus when it’s done in cash in any paper currency. The dilution of the global central banks that print money to devalue their currencies, and stimulate “growth”, affects each and every one of us. It is subtle, which is why and how they get away with it.
I often use the example of the cost of buying a “quality” men’s suit almost one hundred years ago (let’s use 1929, which was ending the roaring 20’s) and today. How many dollars did it cost at that time to buy the nice suit? Using a general calculator and what I found online, the cost was somewhere between $29-45 for a quality suit (a decent one could be bought for $20-29). The same suit at that time could be purchase for one ounce of gold (we know the price was set in the early 1930’s at $35 an ounce). Today, the same ONE ounce of gold can buy you a high quality suit ($1,300), maintaining its purchasing power over almost a century. To the contrary, if we use $35 in USD terms for the suit, you need to cough up 37 times more dollars ($1,300 divided by $35) today. Why? Because of monetary dilution by our central bank. Back then, there was at least a link to gold in terms of how much paper currency could be printed. President Nixon clipped the last tie to gold in 1971 and the acceleration of dollar printed has been exponential to this day, eroding our dollars purchasing power considerably. What would you have had your cash exposure in between the early-id 1970’s and today…dollars or gold? The gold price has increased 37 fold against the USD, while the dollar has eroded in purchasing power to the tune of needing $8 or so 2016 dollars to $1 in 1970. Gold got ahead of itself in 1980 and it does so from time to time, just like it gets way too cheap at times. But, over long stretches (decades), it keeps its consistent value in the world.
This is walking through why gold is so important (and its cousin Silver—which has commanded monetary value at various times in history as well) because it is CASH. It is a CURRENCY and it is the BEST one available to us at this time. Gold actually is an inverse reflection of the currency you view it in. It bottomed out and actually rose aggressively in Rubles, Yen, and Brazilian Real well before we saw the rise begin in dollars this last January. Gold is a global currency and dramatically protected investors that have the bulk of their earnings wealth in the 3 currencies above over the past 3-4 years, if they put some of it into gold before their currencies wilted in value.
I wanted to simply walk through a basic thesis about the store of value and importance in gold in general in this issue. At virtually all times (except when there is a bubble….which is coming in gold and mining stocks) it is appropriate for everyone to have a percentage of precious metals in your portfolio for protection, insurance, and in certain times…growth. Now is one of those times that we can capture all 3. With the world in the state it is in, I believe investors should have a bare minimum of 10% of your investable assets in physical gold and gold related instruments. I have about 65%. And that % for me at some point in the future will decrease to 5-10% because I am NOT a gold bug, I am simply a gold BULL at this time.
I don’t believe that doom is always around the corner and that we need it to make money in gold. In fact, gold has proven that it can rise right alongside stocks, as we recently witnessed from 2002-2007. Additionally, anyone that thinks rising rates is a death knell to the gold prices is gravely mistaken. We only need to go back to the last rising rate cycle in the 1970’s to the very early 1980’s where we saw gold and rates peak together. Perhaps initially rising rates will cause a gold correction, but it is the real rates that matter most, not nominal rates. And, we will see rates/gold rising again in the future again…just wait and watch. In fact, we may have already started seeing it as of this month in September 2016, it is the case so far.
Time to Stretch Your Horizon if you want to get Rich
I want to address what I see over and over as what I feel is the biggest shortcoming of my subscribers. It is the backdrop and foundational worldview that can correct the second biggest mistake I see, which is buying and selling at the exact wrong times (sell low-buy high) based on emotion. We will negate much of that activity if you buy into what I’m about to show you. If you are bullish on gold like myself and believe that we are in a new bull cycle, you likely feel one of two ways. Either the top in 2011 was the end of a secular cycle and this is a new start or like I believe, that this is simply a continuation of the secular bull market that began in early 2001 when gold was trading less than $300 an ounce (USD).This why it is going to be necessary, I believe, to stretch out our timeline when viewing this asset class and the performance to come. Gold went up 12 straight years! From 2000 to 2012, gold rose year on year every time. That is a VERY strong bull market and perhaps unprecedented (I have not found another asset class up 12 years running without a break). Now, a 3 year breather after 12 years higher does not seem like such a big deal, does it? In fact, I would say it is rather healthy if this is indeed a massive secular bull market that will end up lasting 20-30 years in time (very likely and possible). If one of your stocks went up 12 days straight, then digested gains by pulling back fairly hard for 3 days, would you call 911? No. This action in gold/silver is normal and they are inherently very volatile markets!You must understand and accept this fact or you will either lose money, make very little on small trades, or miss the biggest opportunity in my lifetime entirely. When gold mining stocks pull back 20-30% over the last couple of months, after tripling to going up 6/7X since January, I marvel at emails I get asking about the condition of certain companies due to the retracement. Hello?! What do you expect? That prices will go straight to the moon with no shakeouts, consolidations, or pull backs? If gold is destined to go to, say $2,500 an ounce, you better get your head screwed on straight if you want to reap the 10-20-50-even 100 baggers that I plan on having in this newsletter. We earn those investment gains by sitting though periods like this, which is actually quite minor so far in terms of time or severity (there will be much worse before the top). If you can’t handle this little pull back in your portfolio, you may want to reconsider playing in this sand box at all.
Drawdowns Are Necessary
In Charles Billelo’s from Pension Partners recent report “Big Winners and Big Drawdowns” we see the facts behind some of the largest wealth creating stocks over the past 40 years. Below are some excerpts to consider and in each case below there were some very scary and even crushing drawdowns in these stalwarts.Apple, Amazon, Microsoft and Alphabet...
All among the largest and most revered companies in the world.
All have returned unfathomable amounts to their shareholders.
All have experienced periods of tremendous adversity with large drawdowns.
When thinking about big winners in the stock market, adversity and large drawdowns probably aren’t the first words that come to mind. We tend to put the final outcome (big long-term gains) on a pedestal and ignore the grit and moxie required to achieve that outcome.
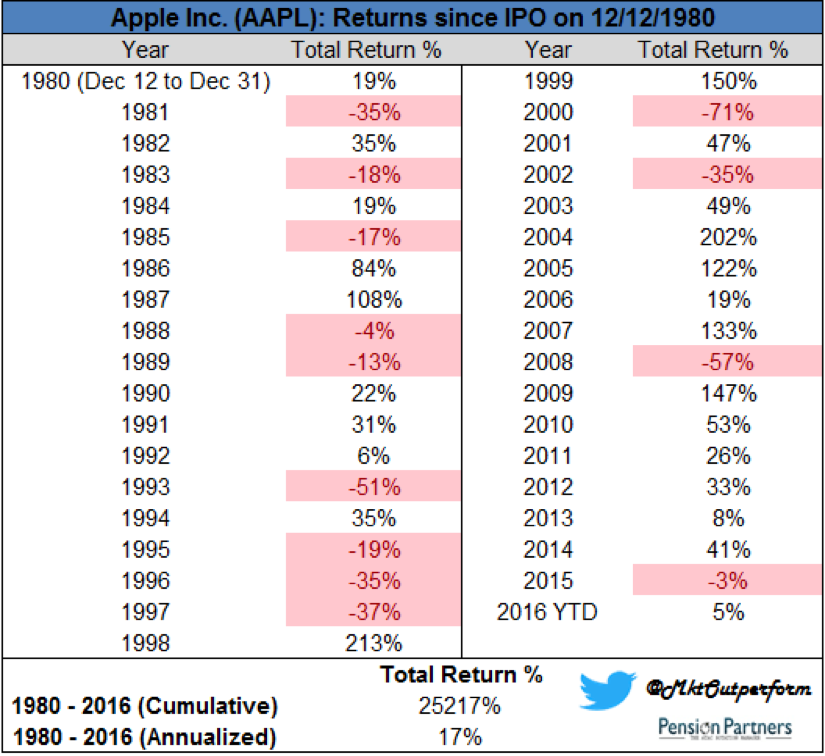
But moxie is the key to long-term investing success, for there is no such thing as a big long-term winner without enduring a big drawdown along the way…Apple has gained 25,217% since its IPO in 1980, an annualized return of 17%.Incredible gains, but these are just numbers, masking the immense pain one would have endured over time.
Apple investors from the IPO would experience two separate 82% drawdowns, one from 1991 to 1997 and another from 2000 to 2003.
Amazon has gained 38,882% from its IPO in 1997, an annualized return of over 36%. To put that in perspective, a $100,000 investment in 1997 would be worth just under $39 million today.Breathtaking gains, but they were not realized without significant adversity. In December 1999, the initial $100,000 investment would have grown to $5.4 million. By September 2001, less than 2 years later, this $5.4 million would shrink down to $304,000, a 94% drawdown. It took over 8 years, until October 2009, for Amazon to finally recover from this drawdown to move to new highs.

Bill Gates is the richest man in the world, having amassed his $80 billion fortune as the founder of Microsoft.
Microsoft has returned 25% a year over the past 30 years, a remarkable feat.
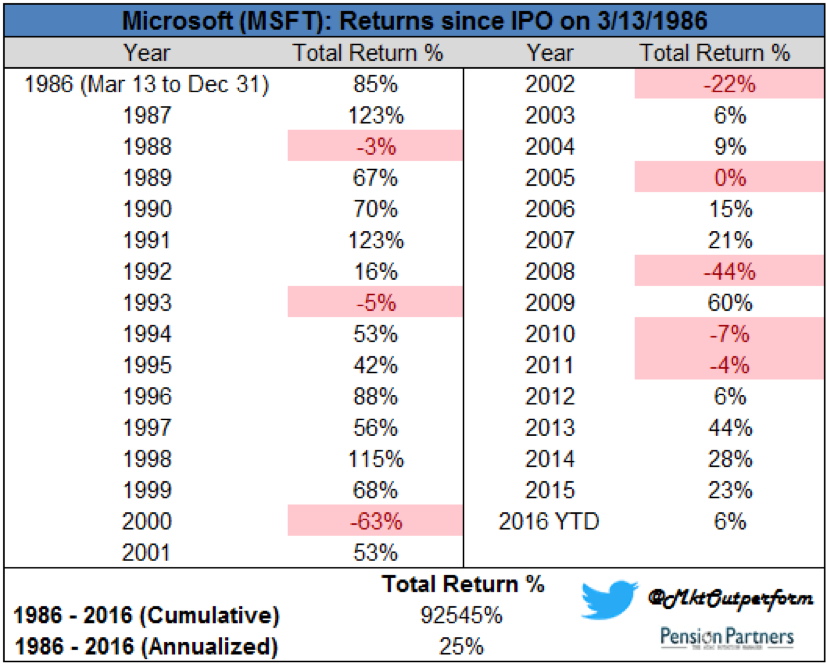
The path to riches in Microsoft looks deceptively easy on the surface. The calendar year returns from its IPO in 1986 through 1999 were incredibly high and consistent, masking significant underlying volatility. In 1987 Microsoft advanced 123% but would suffer more than 50% decline in October during the stock market crash. It would not recoup those losses for two years, until October 1989. Its largest drawdown in history occurred over a 10 year period, a 70% decline from 1999 through 2009.
It should be clear from these four examples that large drawdowns are an inevitable part of achieving high returns. If you haven’t yet experienced such a gut-wrenching decline, then you probably haven’t owned something that has appreciated 10x, 20x or more. Or you simply haven’t been investing for that long.I know what you’re thinking. There has to be a better way. You want that big juicy return but without the big drawdown. Yes indeed, as does everyone else.The problem, of course, is in trying to hedge or time your exposure to big winners, you will likely miss out on a substantial portion of the gains. Or your emotions will cause you to sell at precisely the worst time (after a large drawdown). Your volatility and drawdown profile may be lower, but that tradeoff will come at a price. As I wrote earlier this year (see “The Hedge Fund Myth”) the price for hedge fund investors seeking lower volatility/drawdown in equities has not been a small one, with the HFRX Equity Hedge Index (an investable index of Long/Short equity funds) posting a negative return since 2005 while the S&P 500 has more than doubled.
Many investors in these funds were seeking the Holy Grail, a high return (often 15-20% in their “mandates”) with little risk (no large drawdowns). They expected their managers to pick the Apples and Amazons of the investment world without incurring the inherent volatility that comes along with it. As we know, that is a complete and utter fantasy.
All big winners have big drawdowns. Accepting this fact can go a long way toward controlling your emotions during periods of adversity and becoming a better investor.
**Back to Eric:
Do you know who always thinks short term? Poor people. Because they usually eat hand to mouth so it is very difficult to plan long term. I’ve been there but I also have worked hard mentally to stretch my horizon and think like a rich person with plenty of resources. I remember when I was a rookie stockbroker in 1995/1996 and I put a pitch together to open new accounts with Apple (AAPL).
This was right before they brought Steve Jobs back in 1997 to run the company after he was ousted by the board for a period of time. I liked the brand and felt like it was a classic turnaround story with plenty of potential in a growing computerized world. I had barely any clients back then but I pitched it for a solid couple/few months in the low teens per share. I opened a handful of new accounts and got each of my clients involved. The share price vacillated over the next 6-12 months not doing much. I got impatient and sold out for a “hot play” that came up.
Now, at that time, it was impossible to see the future of Ipods, Ipads, Iphones, and Itunes. But, what if I would have just kept my head down getting clients to invest in this company over years, buying more during big market or company specific corrections. In 15 years, I would probably have dozens if not hundreds of centi-millionaires ($100MM) and have huge wealth myself without all of the stresses of chasing returns. I’m not saying never trade. I still to this day enjoy trading/speculating.However, with core investment positions, it is best to plan on not touching them for a long time. Wealth gets created by investing early in a bull cycle and sitting until it matures, which simply takes time. The only strategy in this regard I do recommend considering is to take your principal risk out of the investments by selling half at a double or 1/3 at a triple (more appropriate in this gold bull). If you can have the discipline to then buy more in your positions during extreme drawdowns, a fortune can be amassed. But I have news for you, “scalping” a penny stock for a 20-50% gain here or there will not get you anywhere. Investors dramatically tend to hold their losers too long and sell winners too early. In fact, averaging up is for pros, down for amateurs, is a saying on Wall Street.The fact is that we have no idea just how high some of these gold stocks can go. You may even want to consider carving out a percentage of your holdings to only sell in terms of time not price. We may think MUX can go to $10 or $20 per share and even have one of those prices as a goal to sell some. But what if it ends up going to $100-$200 per share? I’m telling you…it can and might happen. But the key there will be time. It’s not going to $100 in a year or two but in 4-7 years? Maybe so. Think of Apple and the examples above….who knew in 1995??
Why is it Up/Down?
I will be walking through individual company updates shortly but I think this stuff is important. One of my pet peeves in investing and capital markets is that people are always obsessed with finding a reason behind a movement in a particular market/stock. For example, if you held MUX from my report in May 2015 buying in around a buck. It hits $5 a year later then falls back to $3.50 and you email me “what is going on with MUX? It keeps going down”. I feel like slapping people for these questions sometimes I’m sorry! Obviously, if a stock breaks off from the sector and plummets on news, there is a reason for it.
But in the case above and what is the case 90% of the time, is that stocks go up and down! That’s what they do. Literally, 90% of the cause in any stocks movement/direction is due to the state of the overall market and in particular the sector it trades in. That last 10, maybe 15%, is company specific and that’s where we create an edge in performance by isolating that portion. Individual company news can clearly determine short term movement, but over time sectors move in unison.
A classic investing book that I highly recommend is Reminiscences of a Stock Operator (link here) about the greatest trader of the first half of the 20th century, Jesse Livermore.
Livermore got the nickname “boy plunger” because he would read ticker tapes in brokerage houses and “plunge” into trades with serious conviction, usually making money. His story is fascinating and one of huge highs/lows but some of the lessons have endured the test of time. One of my favorites, and one that guides my outlook considerably to this day, is an example he mentioned at several stages, as to drive home the point. I believe it may be the single most valuable thing that I have ever learned in my professional investing career.
Jesse told of various times that he would go into the office of an old codger, a wily veteran of the stock market, and ask “why” a particular stock was going up or down. Each time, the wise man would say “well, it IS a bull market you know. Or, well it IS a bear market”. This can be clearly understood if we just look at the mining stocks and gold’s performance from 2010-present. In 2010 well into 2011, gold was absolutely still in a screaming bull market. But once the bear stepped in during the fall of 2011 (the same time I launched this newsletter!), every single stock in the sector started to roll over, and hit lower lows over the ensuing 4 years.
I would receive emails about companies like Timberline Resources or Patriot Gold etc where the investor would lambast management for the declines. Or ask what is going on at these companies because the stock keeps going lower. In the back of my head or in my direct answer…..well it IS a bear market! What is so important as I type tonight, is to send the message to you all that we are in a new bull market in gold, silver, and mining stocks and it will not stop for years. Abrupt and sometimes violent pull backs will be followed by fresh runs to new highs, continually frustrating those that got shaken out at exactly the wrong time
.I have a crystal ball. It’s a little hazy in the sense that I can’t see how the zigs/zags will go exactly, but I am VERY confident that gold will hit new all time highs before this is said and done. Minimally, you can make bets based on a retest of the 2011 highs around $1,900 an ounce. I showed back in March, which I was waiting for, how the sector busted up through its long term weekly trend line, proclaiming a new cyclical bull cycle. But, I will point out now that we have one last hurdle to overcome before the gold bull market begins to roar like nothing you have ever heard before. It is the 10 year, monthly trend line. Do you want to “see” why gold is having a tough time right now at these levels?
The chart below goes back ten years. This is actually an enormous tsunami of a flagging pattern that has been building energy for 5 years. Once it bursts, I believe we could start seeing the precious metals begin blowing people away with further strength. The mining stocks have been on an absolute tear this year, but gold hasn’t really shown any chutzpah. But it will baby…oh it will! And we better be positioned ahead of it beforehand, or have to chase prices like the rest of those catching on because of the headlines.

We need to see the price of gold close on a monthly basis at least once between $1,375-$1,400 (ideally $1,400). This is the last step to unequivocally know that the multi year uptrend has begun in earnest. Until then, there is still a slight chance the price rolls over in the channel again, bottoming around $1,000 an ounce. However, I believe that chance is very slim at this point, somewhere in the 10-15% possibility range.
Is it Too Late to Get In?
If for some reason you do not own any or much in terms of precious metals or mining stocks, it is absolutely not too late to do so. The risk will remain being OUT of this sector versus IN it. I really liked Thomas Kaplan’s reply at the Precious Metals Summit about 10 days ago when asked what he would do if looking at the sector fresh and if it was too late after the recent surge in mining stock prices. “Keep buying” he said without hesitation. Obviously, we need to be wise with entry points and accumulate on pull backs (like now) but we are NOWHERE near the ultimate highs we will see in this space.
Nobody owns this sector on Wall Street or Main Street! Most investors either hate it, don’t understand it, or don’t care about it. The strong stock market has actually been nice cover for the stealth surge we’ve seen in gold this year. As far as the current correction in the miners it’s not clear what is next. After a historic run up that we saw in the first 7 months of the year, a rule of thumb would be to reasonably expect a corrective phase lasting 40% of the time of the rally. That would take it into early November to resume the uptrend. It’s less than 6 weeks away now so I’m not all that concerned either way. But if you are truly on board with the view that gold is going a lot higher in the coming years, you should welcome these corrections to buy more miners. This is especially true if you aren’t even positioned meaningfully! Where is your head at right now? Are you skittish? Reading this review is a chance to rethink your goals and beliefs as it pertains to gold and what you want to do.
The daily chart on GDXJ (Junior Miners ETF) below is mixed. It did bust above the triangle pattern and closed above it for two sessions (I like to see 3 for confirmation) but then dropped back into the walls on Friday. A concern is that we are trading below the 50 day moving average. I would not be surprised to see this break either up or down this week. But, we should have some clarity soon

For perspective sake, let’s look at the ten year chart on the gold miners below. As you can see, we are a FAR way away from 2011 highs. The sector almost tripled since January lows but needs to more than triple to get back to the highs. I firmly believe that in this cycle, the gold miners will break out into new highs, alongside the price of gold. There are less companies for money to flow into and there is less gold coming out of the ground due to the ravaging of the past 5 year downturn. The global monetary state of affairs is a powder keg of drivers to want to own gold and we will see $100 an ounce daily gains in the price within 3-5 years I believe.

In summary …
Stretch your time horizon to allow for massive long term gains versus short term piker profits.
Expect big drawdowns in the future on the road to those gains.
Lock in principal risk when a stock doubles or triples so you have no monetary or emotional ties during a big correction.
Make sure that you have at least 10% of your assets in gold related investments.
Get in the habit of buying low and selling high—don’t wait to chase with crowds.
Be patient. Give at least part of your holdings 5 years to see what happens in time.
New IdeasFolks, if you want to full spectrum of action, you should be a premium member. Actions taken now will determine how fruitful the future higher prices in gold will be for you. We have lots of ideas that don’t make it to free members including several we’ve sold completely for huge profits. Others, in the silver arena, won’t be shared in our free newsletter. You can sign up via the subscribe page if interested
.I’ll also be publishing very soon my new top 5 juniors to buy now. This will be a spin-off of our top ten report from late last year which has killed it. Some of those ideas have been removed and new plays have stormed to the forefront. You’ll want to get these ideas early and you can at least get a few of them via being a premium member. A couple may be reserved for whomever wants to buy the report first, so they can have a chance to add a couple of new positions before anyone else. Those will probably be released in chunks of 10 people at a time every few days so as to not disturb market pricing very much.
That’s it for our Fall Review! I hope you enjoyed it and I’m excited to see what gold and the miners decide to do next!
Obviously, I am long in virtually every stock/company mentioned in this report and may buy or sell at any time and without notice to subscribers.
For unique ideas on individual mining stocks, please sign up for our free newsletter below.
Market Report on Gold, Gold Miners, and Uranium
Gold Miners
On a technical note, GDX, GDXJ, and SIL (silver miners), put in a bearish "doji" yesterday on the daily charts. The "wick" that you can clearly see, most times indicates we've hit a temporary top in the larger gold and silver miners. I don't expect much of a pullback, but if you're looking to buy into producers that you missed much cheaper, you may get a slight discount from here over the next week or two. Even if the general stock market takes another dive, as I'm betting on, this time the gold stocks will not go down nearly as much as they did in March, in my view.
That said, I am noticing organic and real rising bids in a good chunk of the smallest gold junior miners!! In my "2020 Random Predictions" report I stated this: --"Junior gold/silver miners see significant capital inflows above $1,700 gold". Well, we are definitely not seeing any "significant" capital flows yet in tiny junior exploration stocks (I'm talking about sub $50M market cap type small). However, we're seeing bids, and share prices moving steadily off of bottoms, which is a start. Is it THE start? We'll find out soon.
Just one example I noticed yesterday is Bravada Gold (BVA/BGAVF), in which I own personally over 10% of the issued/outstanding shares and warrants, closed at .09-.10 bid. This is up from nearly dead volume in March when it touched back down to .05. There has been no news, but companies like this that have put tens of millions of dollars into exploration work over almost 2 decades, are trading for peanuts. At a dime CDN, this company with a 1m oz gold resource at their Wind Mountain project, and another 10 properties in Nevada (a handful are very attractive gold prospects), has a $4.5m USD market cap. I do not know the exact paid in capital amount since inception, but I'm confident in saying it's over $25M put to work on their various projects, if not double that amount. If you look into the details of their assets versus valuation, it's stupid.
This nano cap junior part of the market is absolutely the cheapest and riskiest part of the mining sector, and they are also ultimately going to rise the most in value as well! The organic bids in more than a dozen names I watch appearing, sometimes in earnest over this past week, is encouraging. Once actual real capital trickles down to this "ghetto" of the sector, incredible moves will occur. This is due to the backdrop of gold being in a pristine position to flourish in price, in all currencies, even against the almighty US dollar.
USD/Gold
That said, in the very near term, there is some compelling arguments for another potential rush into USD. Ultimately, and I'm talking intermediate and long term, the US dollar will be, and is being, debased. A surge in USD to $110-120 via another huge leg down in stocks and/or rush to cash, would be cataclysmic for emerging markets and dollar denominated debt globally. There is no way the US can allow too strong of a dollar for any extended period of time, it will wreak HAVOC!
Americans are so lucky that our POS fiat currency is still the globes reserve currency and viewed as the predominant flight to safety when it comes to cash. Yes, it is the strongest fiat on the block. But what happens when inflation, apparently no longer possible according to many "academics", starts to explode on the back end of this brrrrrrrrrr printing press? The currency of last resort is GOLD. It is the true measure of money, and the US dollar will BOW to it in terms of price, and in terms of IMAGE in the coming years. Traditional asset managers and institutions are out to lunch here and have some likely rude awakenings coming their way. Allocations in gold remain minuscule, but this is beginning to change.
So, in the short term, yes I have a strong chunk of USD that I am sitting on and it may get even stronger in the near term. But, the safest store of value of wealth over the coming 1-3 year time frame, let's say, is Gold. In fact, I have been quite conservative, I feel, in my views on ultimate price targets for gold's secular bull market. I always say that if we see $2,500-$3,000 gold, we are going to make utter fortunes in our mining shares, which I still believe.
I've used $3,000 an ounce as a modest target because if you take just HALF of the bottom to top percentage move in the 1970's, golds last major secular bull market, we would get a price of $3,200 USD (up from just under $300 in 2001). Based on what I'm seeing on MANY levels, I'm officially raising my forecast to $5,000-$6,500 per ounce gold. I believe that we will hit the $2,500-$3,000 level within 6 to 15 months on the outset. $2,300/$2,400 is likely by January 2021, if not sooner (which is just 8 months away). A retest is a "given" in terms of the 2011 highs at $1,900 and change and it will be interesting to see how long and how many attempts are needed to break it.
I believe it will take 2 attempts max, and do so within a quarter (maybe 2) of the first test. Once gold breaks through $2,000, which is only 15% away(!!!), we will swiftly begin entering a period of mass institutional and retail FOMO (fear of missing out). The frustrating activity from 2012 all the way until last year before it finally broke $1,400, will be a distant memory. Ray Dalio, Paul Tudor Jones, Peter Thiel, Raoul Pal, Paul Singer, Stanley Druckenmiller, and another dozen of the most successful prominent billionaire investors I could list agree with me. These guys are early, they are not late to a party! Who doesn't find gold at least intriguing in this environment? Warren Buffet, Wall Street sheep, and people who do not understand its function, that's about it.
So, I hope for the sake of you that are STILL (Hello???) underweight gold, silver, and mining stocks, that we see a near term pullback/pause. I've had a long term accumulate/buy up to price on gold to $1,600 for years, based on there being at least 100% upside from there ($3,000-$3,200). I'm raising that to $1,800 for those with no gold position. Don't wait for a pullback if you're naked! At least get something on the books. Then if/when we get a sharp snap back, be ready to buy more. The same with gold mining stocks, which are very likely the most compelling sector in terms of valuation and future earnings growth power on planet earth right now!!!
Q1 2020 earnings season will be the start of big money realizing how good gold producers profits are going to be moving forward. It will be a small early taste, but I expect significant exceeding of expectations by the majority of gold producers this Q1 earnings season. Show me ONE analyst that modeled in an average gold selling price of $1,600 for Q1! That's up from about $1,470 in Q4 and $1,325 on year over year comps. This gold price environment, including now a massive discount on one of their largest costs (energy), for a sector that has had to continually tighten their belts for 7 years, is going to be extraordinary for cash flow growth and M&A activity!
Q1 earnings for so many industries are going to be disastrous, Q2 likely even worse. Once earnings start to flow in earnest shortly, with abysmal or removed forecasts, it's the trigger I feel will stop this dead cat bounce rally in major indexes. For gold companies however, it will be a completely different story.
Uranium
Another one of my random 2020 predictions was: --"Uranium stocks become hot again and are one of the best performing sectors in the market."
I believe we're just starting to see this coming true as the sector has seen a very powerful bounce off of the March lows (many doubling or more). Uranium prices have been rising steadily the past few weeks, up nearly 50% in short order. Supply has been shut down massively by several of the worlds largest producing mines and now the big catalyst for US uranium producers AND explorers is imminent:
Part of the reason I felt good about uranium stocks 4 months ago was because I had known this was coming since last fall. The Trump administration is going to make things VERY attractive for domestic companies to find and produce uranium. Valuations for certain US based uranium stocks could explode in the coming months and years. This sector has been on its back for a decade and is well overdue for a comeback.
I have one huge primary junior position in Encore Energy (EU/ENCUF), which recently put out a press release outlining very well the current state of affairs in the uranium market. I've posted that below, which also gets into details about their assets. This deal has an approximate $20m USD market cap at yesterdays closing price with nearly 50 million pounds of US based uranium resource (inferred and indicated). So, you can buy uranium in the ground at .40 per pound (spot price is $32 per LB on its way to at least $45-50, I believe) and get all of their other assets for free (huge land position, valuable data library, and mill).
This is primarily the same team that advanced Energy Metals Corp from penny stock to a $1.8 Billion exit at the peak of the last uranium bull cycle. The upside here is very large in my view and it finally looks like uranium is going to get some love from the market. Obviously you can move up the chain and get your exposure via Cameco (CCJ), or a mid tier listed company like Nexgen Energy (NXE), which I own as well.
Check out some of the stats in Encore's recent PR and keep an eye on this sector.
ENCORE ENERGY PROVIDES UPDATE ON MAJOR REDUCTIONS IN URANIUM SUPPLY
EnCore Energy Corp. has provided an update on material developments affecting the uranium market and its implications for the long-term outlook of the company's portfolio of significant U.S. uranium assets.
Highlights:
About 50% of world mine uranium production has been halted and the spot price of uranium has increased by +30% in less than a month;
EnCore is well positioned for rising prices with a portfolio of significant U.S. uranium projects, including ISR amenable Sandstone-hosted resources, and high-grade Breccia Pipe properties;
EnCore's management team has extensive experience in all phases of the nuclear fuel cycle;
EnCore has a healthy treasury and no debt.
As a result of the ongoing COVID-19 pandemic, seven of the world's ten largest uranium mines have been temporarily halted, representing approximately 50% of global mined supply. This major reduction in mine supply has resulted from halted operations in Kazakhstan, Namibia and South Africa while Cameco's Cigar Lake Mine in Canada has been placed on extended care and maintenance.
The ultimate extent of supply reductions has yet to be determined but is expected to be significant. With demand continuing at a steady rate, along with a reduction in mined supply, the Company anticipates significant declines in uranium inventories. This anticipated decline is likely to accelerate rising prices in order to incentivize new sources of production. We have seen early indications of this trend with prices for all forms of uranium and equivalents having increased substantially in recent weeks. The uranium spot price has increased by over 30% to US ~$32 per pound as of April 17, 2020 from US ~$24 per pound as of March 23, 2020.
The severity of current supply disruptions underscores the need for security of supply, a key driver behind President Trump's plan to establish a strategic domestic uranium reserve (See News Release dated February 19, 2020). The Company is encouraged by the President's initial actions to reinvigorate the domestic nuclear industry along with his continued emphasis on removing unnecessary regulations and improving access to critical minerals on federal land.
EnCore Energy's Significant U.S. Uranium Portfolio
The Company is well positioned for higher prices with a portfolio of significant U.S. uranium projects. The portfolio is highlighted by advanced-stage Crownpoint and Hosta Butte ISR projects, which hosts Indicated Mineral Resources of 26.6 million pounds contained within 12.7 million tons grading 0.11% eU308 and Inferred Mineral Resources of 6.1 million pounds contained within 2.8 million tons grading 0.11% eU308(2). Importantly, Crownpoint is permitted under a Nuclear Regulatory Commission License to recover up to 3 million pounds per year.
The Company's Marquez Project, a past-producing underground mine within the Grants Mineral Belt of New Mexico, hosts another large uranium endowment. A 2010 NI 43-101 Technical Report documented Measured and Indicated Mineral Resources of 9.1 million pounds contained within 3.6 million tons grading 0.13% eU308, an Inferred Mineral Resource of 4.9 million pounds contained within 2.2 million tons grading 0.11% eU308 at the project.*
Equally significant, the Company holds a dominant land position within Northern Arizona, the highest-grade uranium district in the U.S. with an average recovered grade of over 0.60% U308, and located within trucking distance to the only operating uranium mill in the U.S. The Company holds more than 80% of all current mineral claims within this district with 467 claims that together with state mineral leases span more than 10,000 acres.
An innovative targeting approach using an airborne Versatile Time Domain Electromagnetic (VTEM) survey provided an exploration approach for evaluating the district as a whole and resulted in 145 validated targets within the Company's land package. A total of nine targets have since been drilled with eight having intersected significant mineralization, an 89% success ratio.
As reported by the U.S. Geological Survey, Northern Arizona Breccia Pipes are an important source of uranium from both an economic and national security perspective. Increasing access to this large, high-grade uranium endowment, which is now subjected to a temporary withdrawal dating from Obama Administration, is consistent with President Trump's stated goal of increasing access to critical minerals on Federal lands while at the same time reinvigorating the domestic uranium mining industry.
In addition to a strong portfolio of properties, the Company also controls a leading U.S. proprietary database. The most recent additions are the Quaterra (Metamin U.S.) and the VANE Minerals (US) LLC files with emphasis on the northern Arizona Breccia Pipe District. This vast data collection includes the Union Carbide worldwide database, the UV Industries database, the W. R. Grace uranium related files, Uranium files from Federal Resources, Ranchers Exploration uranium files (Hecla), select Atlas files, and a number of private collections and small partial collections from various companies.
The EnCore Team - A Proven Track Record in the Uranium Sector
The Company is led by a team of uranium experts with a proven ability to build value within the domestic uranium sector. The EnCore team was instrumental in advancing Energy Metals Corp. to compile the largest domestic uranium base in U.S. history before the company was acquired for $1.8 billion during the last major uranium bull market.
This experience has allowed the Company to opportunistically navigate the difficult post-Fukushima uranium market by selectively acquiring high-upside projects, maintaining low corporate expenditures and a healthy treasury, which currently stands at over $3 million in cash with no debt. The team views the ongoing supply disruptions, along with long-term increases in demand, as a bullish indicator for the uranium market and the need for higher prices to incentivize new supply sooner rather than later.
William M. Sheriff, the Executive Chairman of EnCore Energy, was a pioneer in the uranium renaissance as co-founder and Chairman of Energy Metals Corp. He was responsible for compiling the largest domestic uranium resource base in U.S. history before the company was acquired by Uranium One, where he continued to serve as a Director.
Dr. Dennis Stover, Chief Executive Officer, is a renowned uranium mining expert with a 40-year career focused on direct involvement with commercial uranium exploration, project development, and mining operations. Dr. Stover served as Chief Operating Officer for Energy Metals Corp. and then as Executive Vice President, Americas for Uranium One, Inc. where he oversaw commercial development of Uranium One's substantial U.S. uranium assets as well other uranium assets in the Americas.
Dr. Douglas Underhill, Chief Geologist, has 50 years of both domestic and international experience with natural resource exploration, development and analysis, including 40 years with a specific emphasis on uranium. For a decade, he served as the Uranium Resource and Production Specialist with the International Atomic Energy Agency.
Richard Cherry, Board Member and a veteran nuclear industry executive, has worked for leading companies in the areas of uranium mining, production, conversion, marketing and power generation operations for 40 years. Mr. Cherry previously served as President and CEO of Cotter Corporation and Nuclear Fuels Corporation, both affiliates of General Atomics Corporation, where he oversaw their mining and milling operations in Colorado.
Mark Pelizza, Board Member and environmental expert, has spent 40 years in the uranium industry that involved with numerous commercial U.S. ISR project. He was responsible for the permitting and licensing of the Church Rock, Crownpoint and Unit 1 projects in New Mexico. His licensing efforts led to the Company's Crownpoint project receiving an NRC license. He previously served as Sr. Vice President of Health, Safety and Environmental Affairs with Uranium Resources Inc.
Eugene Spiering, Geologist, has over 30 years of experience including 10 years focused on uranium in the U.S. Significantly, Mr. Spiering oversaw the application of VTEM aerial surveys to the Company's large land holdings in Northern Arizona and subsequent drilling that led to two new discoveries and revolutionized the exploration approach for this district, with an 89% success rate.
Gordon R. Peake, Director of Lands, previously served as Vice-President of Lands for Uranium One Americas, Inc. from 2007 to 2010 and with Energy Metals Corporation (US) from 2004 until 2007. He brings over 40 years of experience in natural resource exploration, development and production having worked with major and junior mining companies.
Nuclear Energy for the 21st Century
Nuclear power is an important part of the global energy mix and currently provides nearly 20% of all electricity generated in the U.S. and 55% of emission-free power, far more than wind and solar combined. With an increasing global recognition on the importance of reducing carbon emissions while at the same time meeting the growing requirements for 24/7 baseload power, nuclear power is essential for meeting both environmental and economic initiatives.
Ongoing global expansion, license extensions and new technological advancements are expanding long-term demand. Russia, China and India continue to be an area of rapid growth. These three nations collectively account more than 70% of all new construction. Even with China's large-scale nuclear buildout, nuclear is planned to meet only 4-5% of China's electricity demands. By comparison, the U.S. currently generates nearly 20%, indicating the potential for greater expansion of China's nuclear generating capacity.
The U.S. currently operates 96 nuclear power plants. In 2019 these plants generated a record 809 million megawatt-hours of electricity, the highest total since the birth of commercial nuclear power in 1957 while achieving a record-high 93 percent capacity. A total of 88 of the 96 reactors now have been granted operating life extensions from 40 to 60 years. In December 2019, the Nuclear Regulatory Commission granted the first-ever license extension to 80 years and subsequently again in March 2020. The continued lifespan of these reactors, combined with a world-class safety record, underscores the ability for long-life power generation and continued demand. Two new state-of-the-art reactors are also nearing completion in the state of Georgia.
New technological initiatives are providing new applications for nuclear power, improving the efficiency of existing operations, and incorporating additional safety measures. Several accident-tolerant fuel rods have been developed including Westinghouse's EnCore fuel rods, now adopted in commercial applications. Small modular reactors (SMR) are being rapidly advanced in the design and permitting phase for widescale use and are attractive due to lower capital costs and the ability to operate in a variety of locations. A number of other developments including modern reactor designs have the potential to further increase demand well into the future.
*I own shares of Bravada, Encore, and Nexgen and may buy or sell my shares anytime without notice.
GIL Summer 2018 Update
Even when gold ran to $1,370 in early April, gold mining stocks were trading like garbage. Many of us were baffled at what was going on. Aren’t the mining stocks supposed to lead the metals? Well, yes they are and they still do! Apparently the gold/silver shares were trading poorly because they were forecasting a weaker gold/silver price…what a concept!What has definitely been missing with these gold runs above $1,300 is gold stock sector strength. However, I believe that conditions are already showcasing this phenomenon subtly but quite clearly. We are in for a phase where gold/silver equities show marked strength versus the metals prices and there finally is evidence that it is beginning now. First, let’s look at Gold itself…

As you can see gold is very oversold with a 22 RSI on the daily chart as of July 2nd. However, both seasonality and the COT (commitment of traders report) lay out a very likely rally from here.

Another visual on seasonality over the past 20 years:

Here’s a tweet from Fred Hickey on June 29th, commenting on the seasonality chart:“Best day of summer to buy gold (b4 seasonal rally), DSI index at just 8 -lowest since Dec 2016 (b4 big gold rally). Last Friday's COT: Managed Money net spec long futures lowest since Jan. '16 (b4 gold/gold stock explosion higher). Spec short increase highest in at least 10 yrs”Then a follow on tweet after the COT report was released:“Gold rally setup's even better with just released COT report. Another 12K short futures contracts added, bringing 2-week total short increase to 46K -a stunning 63% jump. Large spec net longs down close to early July 2017 level - from where $140oz gold rally began on 7/7/17.”When open long interest by money managers turns to levels in the next photo, the average return has been 13% over the next 3 months. Total open interest in GLD by options traders is nearly its lowest reading ever.
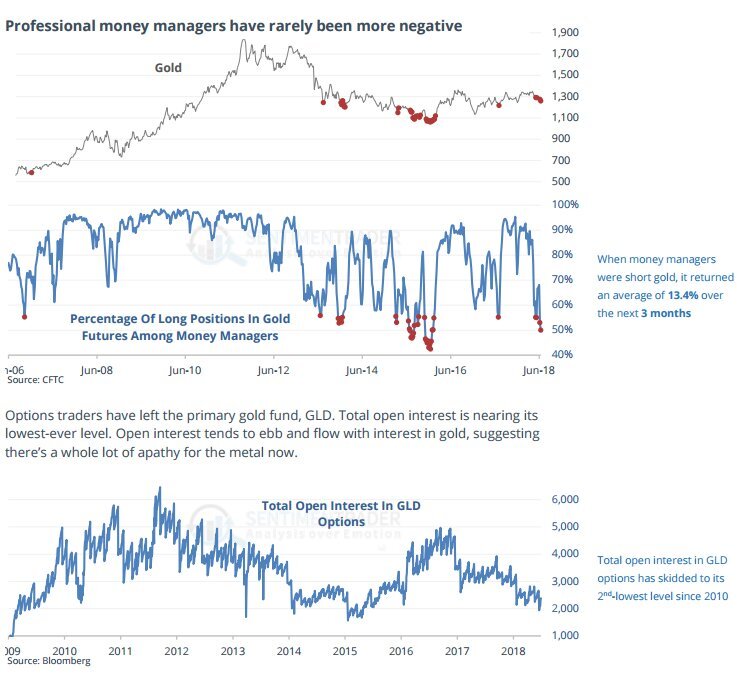
The Hulbert sentiment index also has an extreme reading with gold market exposure among market timers at minus 13. This is a tremendous set up for a gold rally!

Certainly these are widely known resources to gauge the gold market but the most striking signal has come from an unlikely place. The premium over melt value on rare/semi rare gold coins from the late 19th and early 20th century are currently near zero!! Meaning, the markups on these are about the same as modern coins, which is a rare phenomenon. In 2011 for example, premiums on these exact coins were over 100%!This is actually a big opportunity for those of us that hold modern gold coins. I would strongly suggest contacting your dealers to find out the cost to send in your newer coins and receive a similar amount of St Gauden or Double Eagles from the early 1900’s/late 1800’s. If it’s a nominal fee, which some investors are reporting. There is no doubt that these coins will trade at significant premiums once again in a strong bull run in gold. This is a rare and huge opportunity for those that want to take action. At minimum, if you don’t want to send your coins in for a trade, buy some of these semi rare coins outright at these levels.When the market presents an opportunity to buy gold coins from 1877 at the same price as going minted in 2018, you do it! This speaks volumes to the bearish, dead, hated, and ignored gold market which is a very bullish sign from a sentiment standpoint.
Gold Stocks
How about the gold stocks? Well I’ll leave you with one chart and that is the GDX:GOLD action below:

Not only is this a big breakout from cup and handle formation last Friday, we’re about to see a “golden cross” this week, which is another bullish technical pattern.Listen, this data is very important and points a myriad of fingers towards a pending gold rally, led by gold stocks. But my best indicator is just to look around! You know many of these companies/stocks and see where they are trading….it’s incredible! I feel like we have been the frog in boiling water for 2 years that have been desensitized to just hot bad/hot it has actually gotten.I also say that gold trading around and recently above $1,300 an ounce USD in the face of a record stock market, rising dollar, rising real estate, rising technology stocks, rising crypto currencies, rising rates, and everything else going on….is actually showing incredible strength! Wait until the circumstances set up an environment where gold has tailwinds instead of constant headwinds in the global markets.If we see a normal rally from the conditions outlined above, we’ll see many of our junior gold/silver stocks double by December. 30-50% on large and mid cap producers will be very normal. And that will be just normalizing! Things are extreme on the bearish side right now so I am an active buyer of physical gold, physical silver, gold and silver juniors, and gold/silver producers. When the stocks outperform the metal, we saw how strong they can be during the first half of 2016. I expect something in between a similar move and half that move which would still be extremely profitable in percentage terms (GDX/GDXJ tripled in that timeframe).Don’t lose your resolve now gold/silver investors! This is a time to be vigilant active buyers bot sitting around crying in your coffee. Or even worse…..ambiguous!
For updates on unique ideas on individual mining stocks, please sign up for our free newsletter below.
Garibaldi and Metallis—The Big Score Part Deux?
Garibaldi Resources
So you want some action? Ok, we’re going to give you some action! Myself and GIL elite/premium investors have already been seeing quite a bit of action as we have been following the Garibaldi Resources (GGI/GGIFF) E&L Nickel Mountain situation since August. Amazingly, less than 90 days ago, GGI was trading for 17 cents per share and had been basing between pennies and 20 cents for 2 years! On Friday, it closed at $3.89 up over 20 FOLD in less than 30 months. The kicker here is that it is still very likely going much higher despite this massive short term run.Here is what we know from Garibaldi’s last press release:Highlights:
All 11 additional holes completed since EL-17-01 (see Sept. 1, 2017, news release) have returned broad sections of disseminated to blebby net-textured sulphides (pyrrhotite-pentlandite-chalcopyrite), hosted in olivine gabbro, consistent with a much larger-scale mineralizing event than ever previously suspected at Nickel Mountain.
X-ray fluorescence analysis of drill core supports the very high tenor of the sulphide at Nickel Mountain as previously disclosed by the company (photos of representative sulphide-bearing core from the new discovery zone are available for viewing at the company's website).
Assaying of drill core is being carried out by SGS in Vancouver and Garibaldi eagerly anticipates reporting initial results as they become available during the second half of this month.
Dr. Peter Lightfoot, an internationally recognized nickel sulphide expert and a technical adviser for Garibaldi, commented: "The host rocks at Nickel Mountain comprise a differentiated sequence of variable-textured and orbicular-textured gabbros and olivine gabbro with abundant disseminated interstitial sulphide. The exceptional tenor of the sulphide is a compelling feature of Nickel Mountain. “"When viewed in a global context," Dr. Lightfoot continued, "Nickel Mountain is a classic example of an intrusion produced by open system emplacement of silicate and sulphide magma through a dynamic magma tube within a differentiated gabbroic complex. This intrusion represents an open system magma highway along which successive batches of silicate and sulphide magma were emplaced."What does this all mean to us non geologists? That this nickel-copper sulphide rich ore body is rare, valuable, and likely massive! This whole situation is very reminiscent of the well documented unfolding of the Voisey Bay nickel discovery in the 1990’s by a small company called Diamond Fields. It is a straight up sin for any resource investor to not have read The Big Score by Jacquie McNish.In fact, those of us that have absorbed how Voisey Bay played out have realized that it probably isn’t wise to let go of our paper in GGI (or their neighbor Metallis Resources (MTS/MTLFF)-which I will focus on next) easily. The fact is that we have enough information already in my view to know that this is a special discovery. Most people wait for assays, 43-101’s, and more information to be released first but by then GGI will be higher and likely much higher than it is now. Speed is key in these situations and we are already seeing some big money taking swift action to secure stakes in GGI and Metallis (MTS/MTLFF).Falconbridge moved very fast to take a 10% stake in Diamond Fields/Voisey Bay early on, paying $108MM (over a billion dollar valuation) with zero 43-101 resource. Things moved so quickly that Diamond Fields stock went from pennies to $172 per share within 18 months before it was acquired by Inco for $4.5 Billion. When the ore body is real, and it is big, and it is rich, there is not necessarily a cap on how high it can go. There are already credible people that believe Garibaldi’s Nickel Mountain is bigger than Voisey Bay. Are they right? We’ll find out soon!
Sprott Takes Down a Stake
I met Eric Sprott last Friday at the Palisade Hard Asset Conference in Jekyll Island, Georgia. I greatly respect Eric primarily due to the fact that although “retired”, he is actively helping others in this business succeed. He is a valuable source of capital to junior resource companies with his personal cash, backing entrepreneurs dreams. Additionally, he spoke at the Palisade conference to support a couple of up and coming guys in this business. It’s very encouraging that Eric is still sharing his time and knowledge with younger guys like us that will be the next generation of junior mining financiers.I bring up ES because not only is he one of the most connected and successful investors that exist in this sector, but because he has been all over this discovery early and heavily. Plus, he is STILL BUYING shares of GGI and MTS in the open market. That is in addition to a seven figure private placement at 82 cents on GGI AND another $5 million he just put in at $3.15 in a $10MM financing (his piece just closed on Friday). He also just bought 400,000 shares in the open market at $3.75 on October 13th so for everyone that thinks you already missed this one, have you?!Keep in mind that the run thus far hasn’t even included assays on the most recent 12 holes, which are due this coming week. I expect GGI to confirm very high grade massive sulphide intersections as the photos of core on their website show:
http://www.garibaldiresources.com/s/Photo_Gallery.asp?ReportID=768260
Two drill rigs are still turning in the Golden Triangle camp, despite the onset of winter which can be brutal in this area. However, the company has a tiger by the tail here and seem to have the resolve to push through and continue drilling. At $4 per share, Garibaldi has a $330M market capitalization but if this is even half the value/scope of Voisey Bay, the price would have to hit $28 per share on a 50% of the $4.5B buyout comparison. We do not know if this is the case or not, nobody does yet. But it is good to realize now that this deal could have some serious legs. In fact, I am forecasting $7-8 per share by the end of November/early December as a next target , which is why I decided to write this up now to everyone.If correct, you can buy in, sell half at a double, and see what happens risk free after that. Eric made two key points about GGI/MTS at last week’s conference. First, that Nickel Mountain rocks are showing some similarities to Norilsk, not necessarily just Voisey Bay. Remember, Norilsk is/was even more valuable than Voisey Bay! If that’s the case, this could become one of the most valuable nickel-copper deposits in the world and is a once in a generation discovery. It seems that the rocks are showing a unique blend of similarities to both of these examples and some of its own unique properties as well.
Metallis Resources (MTS/MTLFF)
Dr Peter Lighfoot is a world renown expert on nickel sulphide deposits and is advising Garibaldi on this world class discovery. It seems his theory is that the ore body is actually a string of deposits, a “pearl necklace” of sorts. This part of Garibaldi’s last press release on drilling is telling to me: “While the nickel-copper-rich system remains open in all directions at Nickel Mountain, at least two kilometres of prospective ground exist to the east-southeast while a northeast trend of geophysical anomalies and surface mineralization continues for at least six km.”
This is important for those of us heavily invested in Metallis Resources whose Kirkham property borders Garibaldi just over 4 KM to the “southeast”. Essentially, GGI just confirmed that we are half way there, to the border at Kirkham. If the multiple deposit theory proves true and extends to Kirkham, Metallis shareholders could become very rich. I have 90% of my exposure to this play in Metallis, not Garibaldi, which I recommended to premium GIL readers initially at 25 cents in early August. Despite selling off a ¼ of my position around $1 to remove any principal risk, last week I bought all of those shares back and extra around $1.40 per share. I realized that this could be an opportunity of a lifetime and plunged back in last Thursday/Friday.Eric Sprott financed Metallis at $1.10 for 2 million shares just a couple of weeks ago. He has been buying in the open market regularly as high as $1.88 for 400,000 shares on October 13th (the stock closed at $1.45 on Friday). A hugely compelling fact is the tight and tiny share structure in Metallis which barely has a $30MM CDN market cap at $1.45 per share! The leverage here could be enormous and I believe that there is a pretty good chance that MTS can outperform GGI between now and the end of the year. How can that scenario happen?Metallis moved drill rigs to “Thunder North and Thunder South” a few weeks ago, which is near the border of Garibaldi. It is important to note that initially the company drilled a completely different part of their property testing a gold/copper prospect. Those drill results will be out first, perhaps in the next 2 weeks. But if drilling at Thunder North intersects massive nickel/copper sulphides similar to Nickel Mountain, MTS will fly. For example, if Metallis has one third of the resource along the same trend as Garibaldi, their market cap would almost quadruple from $30MM to $110M if Garibaldi stayed at these levels (again, GGI is currently trading at a $330 ish million market capitalization)Now, I believe GGI will run to $7-8 into/after their next batch of assays are released. MTS should hit $2.50-$3 just following GGI so that’s lmost a double as well. But if Metallis confirms high grade nickel/copper sulphides in November, their share price could trade to $5 easily, which would still only be a $100MM market cap. Metallis’ extremely attractive share structure just means that there is very little stock available in the float! Buyers will likely have to pay up, probably WAY up, in the coming months.For what it is worth I only asked Eric Sprott one question last Friday. “Do you believe the Nickel Mountain ore body extends into Kirkham?” His reply was “yes I do”. This is obvious just from his actions in the market but it was nice to hear it as well.
Risks To be crystal clear, there is still a lot of risk in both of these stocks. Even if Metallis is destined for $20 per share, there will be violent pull backs along the way and whip lash like volatility. That said, some circumstances warrant rolling the dice. I’m in a great position because I plan to sell the ¼ I bought back at $3 which will have given me a profit on what I put in as a total initially. Then, I’ll hold ¾ plus of my stake for free versus those of you that might just get in now around $1.50 on MTS. You may want to sell half at a double and let the rest roll if this thing plays out like I think it will. That way, you simply don’t have to sweat the gyrations and can give things time to unfold into 2018.There is a lot of smoke at Kirkham near the fire than is Nickel Mountain so there is better than a 50/50 chance that Metallis has some of this rich ore body on its property. However, the odds are likely less than 50/50 that they hit some of it with the first few drill holes! These are big properties so some patience may be needed and one thing that may slow this train down is old man winter.Just remember, it is new discoveries that drive junior resource share prices more than any other factor. Being early in a big discovery can make investors wealthy and that is why we play in this risky and cyclical arena. GGI and MTS guarantee ACTION in the coming days, weeks, and months. I do not think it’s too late to get involved but would encourage adding soon, at least entry sized positions then on any pullbacks. I would suggest adding MTS up to $1.75 and GGI to $4.50. If the gap around $1.21 gets filled on the MTS chart it would be time to back up the truck.Lastly, I would like to acknowledge the guys at Bull Market Run. They were definitely on top of this situation before anyone else and are the reason that I was tipped off early on. They do great work and have gone the extra mile in keeping investors updated!Make sure that you are signed up to our free list for updates on these stocks and other special situations…
For updates on Garibaldi and Metallis and unique ideas on individual mining stocks, please sign up for our free newsletter below.
Legal Disclaimer: I am offering ideas for your consideration and education. I am not offering financial advice. I am not a financial or investment advisor and am acting in the sole capacity of a newsletter writer. I am a fellow investor and trader sharing his thoughts for educational and informational purposes only. Garibaldi and Metallis is a paying sponsor of GIL so I have a conflict of interest. Do your own homework before acting on anything that I say. Opinions and analyses were based on data available to authors of respective essays at the time of writing. Although the information provided on the Website is based on careful research and sources that are believed to be accurate, Mr. Muschinski does not guarantee the accuracy or thoroughness of the data or information reported. The opinions published on the Website belong to Mr. Muschinski or respective associates and are neither an offer nor a recommendation to purchase or sell securities. Mr. Muschinski does not recommend services, products, business or investment in any company mentioned in any of his essays or reports. Materials published on the Website have been prepared for your private use and their sole purpose is to educate readers about various investments. By reading Mr. Muschinski's essays or reports you fully agree that he will not be held responsible or liable for any decisions you make regarding any information provided in these essays or reports. Investing, trading and speculation in any financial markets may involve high risk of loss. We strongly advise that you consult a certified investment advisor and we encourage you to do your own research before making any investment decision. Mr. Muschinski, Gold Investment Letter's employees and affiliates, as well as members of their families, may have a short or long position in any securities, including those mentioned in any of the reports or essays, and may make additional purchases and/or sales of those securities without notice.
Southern Silver Site Visit and Valuation Update
On January 28th, 2017 I traveled to Durango state Mexico to tour Southern Silver’s (SSV/SSVFF) Cerro Las Minitas property (CLM). Lesley Stokes from the Northern Miner was with us and she wrote up an informative article last week.I initially published a public report on SSV in May 2016 at 14 cents per share which you can read here.

[Our editor on site at drill #92]
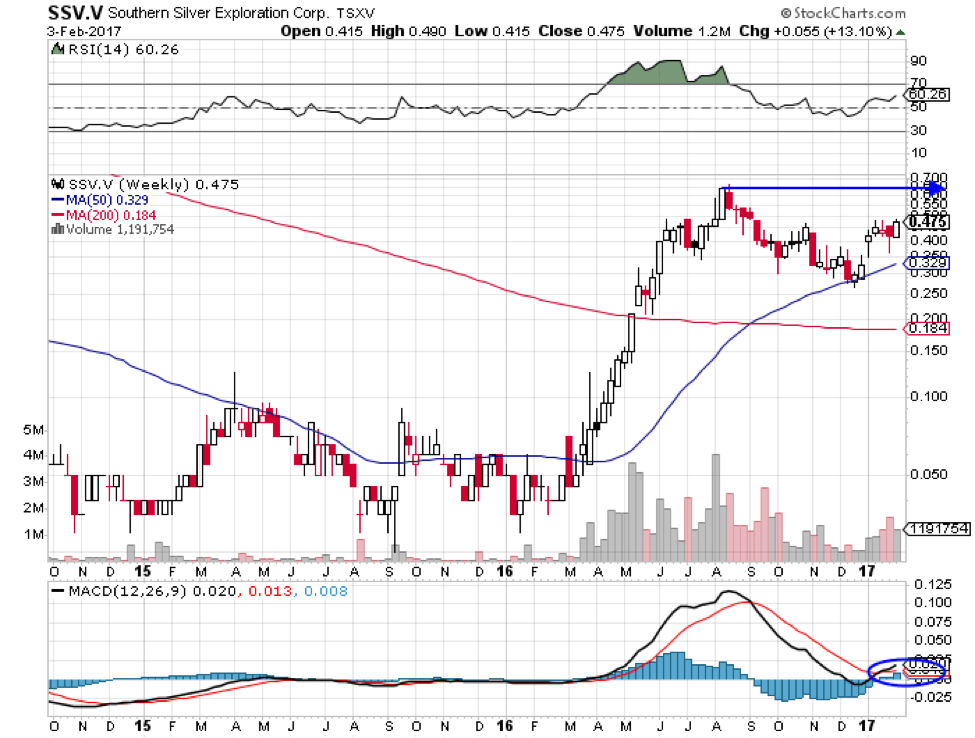

Interestingly, if you look at the long term 10 year chart I posted back in May, I circled two target areas at that time. The first circle was around 50 cents. The share price broke above 50 back in August last year hitting a high of 66 cents but fell back and has been consolidating below 50 cents for 5 months. Guess where we have been seeing resistance recently? 47-50 cents. What is encouraging though is that on the weekly chart below, we are seeing bullish confirmations in a very recently rising MACD (bottom right) and reverse head and shoulders pattern. Technically, it is highly likely that the next move resolves itself upwards not only besting 50 cents per share but also the previous high at 66 cents.I want to note the second target area I circled almost 9 months ago when the share price was just 14 cents, which is at $3. It won’t go there overnight as the next major resistance area after besting last year’s high will be at $1. Once $1 is broken, $3 per share should actually happen a lot faster than it took for the price to get back to $1 from bear market lows. What could be the catalysts for such a surge besides rising silver/zinc prices? It could very well be the potential doubling of the resource this coming summer. The current resource at CLM is 36.5 million indicated silver equivalent ounces and 77.3 million inferred equivalent ounces containing primarily silver, zinc, and lead. The current in situ value of the resource exceeds $2.3 Billion and has grown several hundred million dollars due to zinc’s huge rise in 2016. The company is now in the midst of a 10,000 meter drill program with an ambitious goal to double the current resource. The $2MM program is being funded by the Electrum Group who is earning into 60% ownership at CLM and SSV will own 40% once the money has been spent (Electrum will have spent a total of $5MM at CLM by this June).
[Core shack]

“We already have a great deposit as it is, but once we hit the Blind Shoulder zone we just started following the high-grade, and we think we can double what we have right now,” Macdonald says during the drive to the property.The quote above is referenced from the Northern Miner article via SSV geologist Rob Macdonald. Obviously, there is no guarantee that they will double the resource but I will say that the SSV team certainly feels confident in the plan to do so. Right now at 48 cents CDN, the market cap of $40MM is valuing each silver equivalent ounce at 30 cents. I believe that is too cheap and I see many examples with silver equivalent ounces valued at $2 (Defiance Silver) or even $4 (Alexco). What is a fair value? Once SSV is in the PEA or pre-feasibility stage (we’ll see what’s next….probably a PEA but they will have to review the plan with Electrum this summer once results are known), $1.00 per equivalent ounce is very reasonable. In fact, $1 per OZ right now is reasonable.At $1 per ounce of silver equivalent resource the stock would be trading at $1.50 right now. Wonder how they get to $3? Double the resource and walla! Keep in mind that these comps are fair with a $17-$20 an ounce silver price. $25 silver and the valuation could easily double to $2 per equivalent ounce or triple at $28-30 silver, which I believe is coming. For now, I’m only looking for $1 per silver equivalent ounce of resource on what they have today which forecasts a $1.50 share price. I’ve been saying $1-2 in 2017 so I’m very comfortable with this price target.
[Cerro Las Minitas--The Hill of Many Mines]*Note the modern highway just meters from the property
One thing that should bolster investor’s confidence is the direct involvement of Tom Kaplan’s Electrum Group. This group is the smart money, make no mistake about that. Kaplan has literally made a fortune by building up plays just like Cerro Las Minitas and they will do it again….and again…and again. In this particular case I’m betting on both the horse (CLM) and the jockey’s. Larry Page via Western Silver has been involved in some monstrous successes as well such as discovering Penasquito in Mexico though Western Silver Corp. This mine now produces almost 1 million ounces of gold annually.I’m confident that in the next sustained move higher in precious metals, the gold/silver ratio will begin to tighten in silver’s favor. At 70 to 1, it is on the very high end historically and should make its way into the 30-40 to 1 area within 2-3 years, maybe even much sooner as silver can make up ground fast when it decides to! I don’t see Southern Silver taking CLM into production as they will be acquired well before then. This is an asset the majors will want and the company could be in play as early as this coming fall after the new resource estimates are on the table. The longer an acquirer waits, the higher price tag they will need to pay so I would rather see an offer in 2018 or once silver is $25 or higher, minimum.More details on mineralization and the various target zones can be read in SSV’s corporate presentation and/or in the Northern Miner article. SSV remains a buy under 50-60 cents and on pull backs. It remains my top junior silver holding. SSV was a sector leader during the huge gold/silver stock rally in 2016 and I expect it to remain an out performer in the next run.For updates on Southern Silver and unique ideas on individual mining stocks, please sign up for our free newsletter below.
Legal Disclaimer: I am offering ideas for your consideration and education. I am not offering financial advice. I am not a financial or investment advisor and am acting in the sole capacity of a newsletter writer. I am a fellow investor and trader sharing his thoughts for educational and informational purposes only. Southern silver is a paying sponsor of our website so my viewpoint may be skewed. Opinions and analyses were based on data available to authors of respective essays at the time of writing. Although the information provided on the Website is based on careful research and sources that are believed to be accurate, Mr. Muschinski does not guarantee the accuracy or thoroughness of the data or information reported. The opinions published on the Website belong to Mr. Muschinski or respective associates and are neither an offer nor a recommendation to purchase or sell securities. Mr. Muschinski does not recommend services, products, business or investment in any company mentioned in any of his essays or reports. Materials published on the Website have been prepared for your private use and their sole purpose is to educate readers about various investments. By reading Mr. Muschinski’s essays or reports you fully agree that he will not be held responsible or liable for any decisions you make regarding any information provided in these essays or reports. Investing, trading and speculation in any financial markets may involve high risk of loss. We strongly advise that you consult a certified investment advisor and we encourage you to do your own research before making any investment decision. Mr. Muschinski, Gold Investment Letter’s employees and affiliates, as well as members of their families, may have a short or long position in any securities, including those mentioned in any of the reports or essays, and may make additional purchases and/or sales of those securities without notice.
NovaGold Resources is Cheap and Oversold


I have begun building a position in shares of NovaGold (NG/NG.TO) in the $4-5 range and believe that the price is very close to a short term bottom. At a closing price of $4.05 yesterday on NG, the stock is off over 30% in the past 7 trading days with an RSI reading of 25 (oversold). The share price was $7.25 as recent as early August so it has nearly been cut in half during this gold miner correction. Now is exactly the time that you want to be buying this stock and the downside looks limited to me.NovaGold owns 50% each in two monstrosities called the Donlin Gold (Alaska) and Galore Creek (Canada-mainly copper but also has 8 million ounces of gold and over 100M ounces of silver) assets. Their partner at Donlin is Barrick Gold (world’s largest gold producer) and Teck Resources (Canadian mining behemoth) at Galore. Donlin is enormous with 34 million ounces of gold reserves and another 11mm ounces in the resource categories. The grade is solid at 2.2 GPT versus the global average at 1.12 GPT and the project is at the permitting stage after 16 years of development. Call it 45 million ounces, which is over $50 billion worth of gold at today’s prices, and the deposit has the potential to double in size from here.Donlin dwarfs all other new gold deposits in North America to the tune of having more M&I gold resources than the next 4 projects combined (Livengood-Brucejack-Meliadine-Rainy River). New discovery potential abounds at Donlin and there is enormous leverage to the gold price where the NPV (net present value) at 5% increases 20 fold with just a double in the gold price to $2,500. NPV at 0% (not valid until closer to or even in production) is over $6B at today’s gold price and goes up almost 5X to $27 billion at $2,500 gold.Galore Creek has over 9 billion pounds of copper, 8 million ounces of gold, and 136mm ounces of silver as well. 6 billion pounds of copper to be produced over 18 years and at $3 copper that will be nearly $1 billion in annual revenues with tremendous margins. NG/Teck project costs of only 80 cents per pound of copper, which is outstanding. I will let investors dig deeper on Galore and Donlin fundamentals as I most importantly want to get this piece published for early October 12th. The price is right to act now and that includes an opportunity to make 20-25% on a trade if that’s your style. But I think this stock can go to $20-$50 per share within 3-5 years based on fundamentals aligned with a gold price that retests the 2011 highs.This is a 10 year, monthly chart on NovaGold above. My chart line may be off by a smidgen but we should see strong support on the stock in the 4$ area. The share price hit $20 in 2007 and $17 in late 2010 and I think the $12-14 range will be retested in the next 24 months, which is a triple or better.Below is the daily chart which shows via the top upper right circle that the price is already becoming oversold near $4. The other circle adjacent to the red line (200 day moving average) is a gap in the chart, which will likely be filled. That’s nearly a 40% return from $4.05 and it could happen within just a few weeks. A very realistic shorter term goal is a 20-25% move back near $5.The weekly chart below shows more signs that the lows are very near here close to $4. We see the long term uptrend line still intact with MACD at the bottom being quite stretched. MACD has been below zero for 10 straight weeks and could easily begin turning up anytime.Lastly, the company has a very impressive board of directors and institutional shareholder base. Thomas Kaplan of the Electrum Group is the Chairman and his firm owns over 26% of the company. When you add in Fidelity (8.5%), John Paulson (8%), the top 5 investors own over 50% of the stock. This is pretty unusual for a north of $1 Billion market capitalization company and speaks to the conviction of some very smart money.I urge readers to begin acquiring shares of NovaGold for long term investment. Also, traders can begin adding as well for a potential 20-25% gain within a month or two (it could reverse within hours/days). You may want to add half immediately and keep some dry powder if the miners decide to have one more flush lower before a sustainable rally ensues. This is the exact type of gift that investors would have dreamed of just a couple of months ago when the share price was surging over $7.I am long shares of NG
For updates on NovaGold and unique ideas on individual mining stocks, please sign up for our free newsletter below:
Seabridge on Sale and on Support


Here in late August 2016 I believe the market is presenting us with a bow wrapped gift in the gold mining sector selloff, in particular in shares of Seabridge Gold (SA/SEA.TO). Seabridge is currently one of the most oversold gold miners in the sector, as it closed today right on its 200 day moving average (DMA). GDXJ as a proxy for the junior sector, closed just below its 50 day moving average (about $47) versus its 200 DMA, which is all the way down near $31.50. SA has had no bad news or financings announced to merit such a drastic variance from the sector. My guess is mainly that it is usually more volatile than the sector, which swings wildly in its own right.
Many of you know my bullish stance on gold and mining stocks and that I believe this new bull cycle just began early this year. After an entire sector triples in 7 months, guess what? Yes, it is due for a breather and even a jolting shake out to flush the Johnny come lately types out before any fresh highs can materialize. We all knew it was coming at some point, and there will be plenty more in the future. The fact is that SA is presenting an excellent extra point right now around/under $11 per share as it is already oversold and sitting right at very strong support levels. I anticipate the bounce to be fairly fierce in percentage terms so this can be traded, yet I am planning on holding a large position long term, for much higher prices.
Once the gold bull kicks into real gear and institutional investors can no longer stay out entirely, I think SA will be a hedge fun darling stock of sorts. The draw mainly being the massive gold in the ground assets the company owns spread over 3 very large projects, all in Canada. This relatively unknown gold company has over 45 Million ounces of proven and probable gold reserves, making it one of the top ten gold companies in the world in terms of reserves size Unfortunately in this brief report, I am not going to dive deeply into a fundamental analysis on Seabridge. The reason is that I think the biggest value in putting this piece out this morning quickly, is the timing, and the window will likely shut to buy SA shares near/under $11 swiftly.
However, I would strongly encourage you to look through the company’s corporate presentation, which lays out the value proposition nicely. In addition, I have linked 2 very recent articles featuring interviews with CEO Rudi Frank which, after reading, you’ll see that this is an exceptional story/situation in the gold sector. Insiders own over 30%, the reserves are enormous, low market cap, and I can go on and on. But most importantly today, let’s go to the charts!

On the daily chart above, clearly the share price is right on/below its 200 DMA, which will act as very strong support and a springboard. Even if the share price flushes to $10 today/tomorrow, the $11 area will then act as a magnet. Also note the RSI on top (circled) which shows a 26 reading as of yesterdays close. This isn’t all that extreme, but considering we’ve seen a 25% plus decline in value in 4 straight trading days, the drop is significantly worse than the sector at large, and when sitting right on major support, it is plenty to justify a strong bounce. But, let’s take a step back and check out the weekly chart….

A picture is worth a thousand words. Hello?? Maybe I’m wrong, but I’m not afraid to call out exactly at the time that I think the market is presenting us with a brief window to buy shares before a fresh move higher. The weekly trend line is very nicely still intact (if the share price melts below this week and next, it would obviously negate this trend). But as of now, near these prices, giving room for a bear trap flush to even $10, as long as we close out the week around $11, the longer term trend is looking lovely. Three chances to buy the intermediate lows on SA/SEA in the past year and I’m saying this is one of them today.
The fact is that even if I’m dead wrong, this is the type of setup and circumstance you want to see to enter a position, or buy more stock. I almost tripled the size of my position on Wednesday, mostly adding at $11 give or take 10-20 cents. I’m now overloaded in Seabridge and it’s one of my largest single holdings. I plan on lightening that up on a bounce to $13 or so, socking away a nice and potentially quick 15-20% profit in hours/days, maybe a couple of weeks. Then I’ll keep a nice large position on for much higher prices.
I can make a case for $50 a share on SA in 24-36 months or sooner and that is actually where I think the stock is going as gold retests its 2011 highs in that timeframe, or sooner. Seabridge will ultimately be a $50-$100 per share stock if they aren’t bought out along the way….watch and see! That will take plenty of time but right now Seabridge and the gold miners are presenting a very compelling risk/reward entry point for traders and investors and I would encourage readers to accumulate today around $11 and the closer to $10 it goes today/tomorrow, if it does, the more aggressive I would be in buying. You can check out the CEO interviews I reference here:
http://sprottglobal.com/thoughts/articles/seabridge-building-out-an-optionality-company/http://www.theaureport.com/pub/na/seabridge-is-turning-cash-into-gold
I’m long shares in Seabridge Gold and may buy more or sell my entire position without any notice.For updates on Seabridge Gold and unique ideas on individual mining stocks, please sign up for our free newsletter below.